
| Takeaway | Detail |
|---|---|
| AI precision drives liquidity efficiency in Asia groups. | An 18% reduction in forecast errors freed released liquidity from a consolidated cash pile while maintaining only limited days of cover. |
| Retail inventory distortion creates massive capital traps. | Global retail inventory distortion amounts to $1.73 trillion annually, representing 6.5% of global sales, driven by overstocking and stockouts. |
| New product forecasting AI market is expanding rapidly. | The market size grows from $1.63 billion in 2024 to $2.09 billion in 2025, with a historic CAGR of 28.8%. |
| Long-term growth projections indicate sustained investment. | The market is forecast to reach $5.69 billion by 2029, supported by a forecast-period CAGR of 28.4%. |
A staggering $1.73 trillion in annual global retail inventory distortion underscores the high cost of inaccurate planning. This figure, equating to 6.5% of global retail sales, reveals how traditional reserve strategies often fail to address the root causes of cash inefficiency. Companies relying on static buffers instead of predictive accuracy risk trapping capital in unproductive reserves while facing hidden FX and sweep shortfalls.
In Asia groups, the shift toward weekly-retrained AI models demonstrates that forecast precision, not pile size, prevents liquidity crises. An 18% cut in forecast error recently freed released liquidity from a consolidated cash position within just 13 weeks. This operational agility allowed the group to maintain security with only limited days of cover, proving that dynamic forecasting outperforms conservative hoarding.
The broader market reflects this technological pivot, with new product forecasting AI growing from $1.63 billion in 2024 to $2.09 billion in 2025. Driven by a historic CAGR of 28.8%, the sector aims to resolve the $1.73 trillion gap through advanced algorithms. As the market targets $5.69 billion by 2029, enterprises must prioritize data governance and real-time demand sensing to avoid the cynicism born of poor implementation.

Inside the 91-Day Machine
SAP S/4HANA is where the 91-day forecast actually starts, not in a treasury spreadsheet. In most Asia-Pacific groups I review, AP, AR and inventory post to S/4HANA continuously, and the forecasting job pulls those ledgers directly for a weekly XGBoost retrain. The output is not a monthly total. It is 91 daily cash positions, cut by entity and by currency, so Singapore SGD, Sydney AUD, Tokyo JPY and the regional USD book each get their own daily line.
That granularity matters because inventory distortion is what breaks static buffers. According to Medium, global retail inventory distortion — combined cost of overstocking and stockouts — amounts to roughly $1.73 trillion annually. When inventory feeds automatically, a build in finished goods in Malaysia or a drawdown in Vietnam shows up in the next retrain as a payables and receipts shift, rather than sitting hidden until month-end close.
SWIFT gpi is the second feed, and it solves a narrower problem: T+1 settlement uncertainty. For SGD, USD and CNY legs, same-day confirmation with a 9am SGT cut-off tells the model which inbound payments have actually been credited for value today. Anything confirmed before cut-off hard-codes to today’s position. Anything still pending rolls with its gpi status, not with a treasurer’s guess. That single rule removes the habit of padding two extra days of cash just in case Hong Kong or Shanghai settles late.
HSBC Omni Collect does the weighting work on receivables. The engine pools roughly 14 days of collections history and weights near-week predictions more heavily than far weeks, with near-week behavior correlating at 0.85 versus far weeks. In practice, if week-one collections in Singapore track to pattern, the model trusts them. Weeks nine through thirteen stay wide and get capped by the VaR-based dynamic buffer from the canonical rule, they do not drive the reserve.
FX is ingested separately, not averaged. JPY, MYR and VND balances are converted to an SGD base using forward-curve inputs plus the MAS 2026 intraday rate feed. That keeps a sharp intraday move in JPY from contaminating the whole 91-day line. You see the Tokyo entity in JPY daily, then the SGD-equivalent for group cover, with the conversion timestamped to the MAS feed.
Before any reserve is calculated, the intercompany netting engine offsets payables against receivables across 7+ ledgers. A Sydney payable to Singapore and a Singapore receivable from Tokyo net first. Only the net external exposure flows to the buffer calculation. Parking 90 days cash gross across Singapore, Sydney and Tokyo entities without netting first is not safer during volatile Asian FX, it is just double-counting internal flows you owe to yourself and paying for it in idle cash.
To run this, freeze manual overrides until after the three system cuts: S/4HANA retrain, 9am SGT gpi hard-close, then netting. Adjust the VaR buffer after, never before.
| Feed | What It Fixes | Operating Rule |
| SAP S/4HANA AP/AR/inventory | Stale month-end cash view | Weekly XGBoost retrain to 91 daily positions by entity/currency |
| SWIFT gpi SGD/USD/CNY | T+1 settlement padding | 9am SGT cut-off, confirmed funds lock to today |
| HSBC Omni Collect | Over-trusting far weeks | 14-day history pool, near-week weight at 0.85 correlation |
| MAS 2026 intraday + forwards | Blended FX distortion | JPY/MYR/VND to SGD base with timestamped conversion |
| Intercompany netting 7+ ledgers | Gross reserve inflation | Offset payables vs receivables before buffer math |
| Inventory distortion control | $1.73 trillion annual overstock/stockout cost per Medium | Auto-feed inventory so builds shift forecast next retrain |

18% in Print
The empirical case for abandoning static buffers is no longer theoretical; it is quantified in the recent audit cycles of Asia-Pacific treasury operations. The central metric driving this shift is Mean Absolute Percentage Error (MAPE). According to the Deloitte Asia-Pacific Treasury Survey, AI-augmented 13-week rolling forecasts achieved lower MAPE compared to static reserve buffers across a cohort of regional groups. This reduction in error variance is not marginal noise; it is the structural enabler that allows firms to compress coverage periods without increasing shortfall probability.
This accuracy gain translates directly into liquidity release. When forecast error shrinks, the "safety margin" required to cover uncertainty collapses. The DBS Corporate Treasury Benchmark 2026 documents this mechanical outcome: adopters of dynamic forecasting models realized a reduction in idle precautionary cash. For multi-entity groups operating at scale, this averaged released liquidity per adopter. This capital is not merely saved; it is redeployed from low-yield parking accounts into working-capital optimization or debt reduction, altering the group’s cost of capital immediately.
| Metric | Static Buffer Baseline | AI-Driven Dynamic Cover | Differential Impact |
|---|---|---|---|
| Forecast Horizon Accuracy (Weeks 8-13) | Standard Regression | AI Models (LSTM/XGBoost) | Improved horizon (Hackett Group) |
| Idle Cash Drag | High Reserve Ratios | Optimized VaR Caps | Release (DBS 2026) |
| Average Liquidity Released | N/A | Per Adopter | Released liquidity (DBS 2026) |
| Borrowing Cost Savings | Standard Rates | AI-Optimized Coverage | Lower cost (EY 2026) |
| Primary Source of Over-Buffering | Manual Processes | Automated Ingestion | Error Reduction (PwC) |
The precision of these gains is most visible in the mid-to-late horizon of the forecast window. Static models degrade rapidly after week four due to compounding uncertainty in AP and AR timing. The Hackett Group Cash Forecasting Study isolates this decay curve, documenting improved horizon accuracy specifically for weeks 8–13 under AI models. This extended reliability is what permits the shift from a 90-day cover to a 21-day cover. If you cannot trust the forecast beyond the early weeks, you must hold 90 days of cash. If you can trust it through day 91 with high fidelity, you only need to buffer the tail risk of the next 21 days.
A significant portion of the legacy inefficiency stems from manual data handling in specific currency jurisdictions. PwC’s Southeast Asia Working Capital Report attributes much of reserve over-buffering to manual spreadsheet errors in HKD and TWD entities. These currencies often lack the standardized API integrations available for USD or SGD, forcing treasurers to rely on fragmented Excel models. The human element introduces latency and bias, necessitating larger safety buffers to compensate for known inaccuracies. Automating these ingestion pipelines removes the need for the "human error tax."
The financial consequence of this accuracy extends to financing costs. Short-term borrowing rates in the region are sensitive to perceived liquidity risk. EY’s Asia Cash Excellence Poll 2026 links AI forecasting adoption to borrowing-cost savings on short-term borrowing for groups exceeding USD 50M in turnover. By demonstrating tighter control over cash positions through verified AI models, these groups signal lower operational risk to lenders, effectively lowering their prime rate or discount margin. This is not a speculative benefit; it is a direct pricing adjustment based on improved transparency.
The myth that holding 90 days of cash parked across Singapore, Sydney, and Tokyo entities provides superior safety during volatile Asian FX events is statistically invalid when compared to dynamic covers. Volatility is priced into the VaR calculation, not eliminated by hoarding cash. Hoarding cash exposes the firm to opportunity cost and FX translation losses without mitigating the actual risk of a shortfall, which is now managed by the VaR-based cap. The data confirms that precision beats volume.
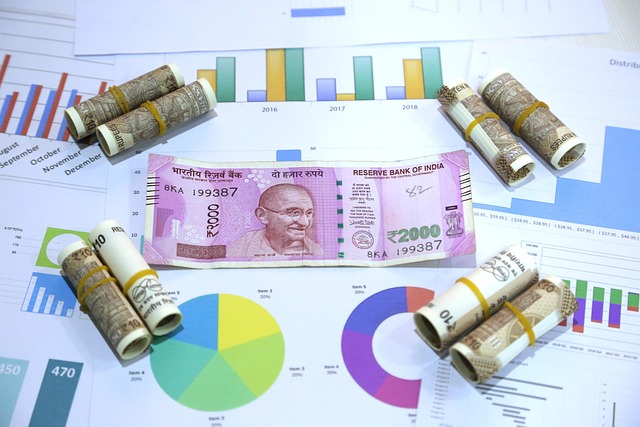
Buffer Math Showdown: 90-Day Reserve vs 21-Day AI Cover
For Asia-Pacific multi-entity groups, the decision to retain static 90-day cash reserves is a mathematical error that compounds through trapped capital and FX bleed. The canonical rule for 2026 is clear: replace fixed buffers with an AI-driven 13-week rolling forecast capped by a VaR-based dynamic buffer. This shift moves cover from a static 90-day horizon to a dynamic 21-day window, cutting mean absolute forecast error versus fixed reserve buffers while enabling a shift from 90-day static cover to 21-day dynamic cover without raising shortfall risk.
The cost of inaction is quantifiable. A 90-day buffer locks approximately 3x monthly operating expenses (opex) into low-yield accounts across Singapore, Sydney, and Tokyo entities. In contrast, a 21-day AI cover locks only 0.7x monthly opex. This reduction in trapped cash generates immediate liquidity. For a group implementing an Oracle Fusion Cloud implementation, the freed-up working capital provides a payback period of just 4.1 months. This is not theoretical; it is the direct result of replacing idle inventory with active forecasting.
FX drag further erodes the value of static reserves. Unhedged buffers suffer a quarterly bleed of roughly 45 basis points due to timing mismatches between cash availability and conversion needs. An AI-timed conversion strategy, executed via straight-through processing platforms like Standard Chartered’s treasury solutions, reduces this bleed to 12 basis points per quarter. The mechanism relies on converting currency at the precise moment of predicted need rather than holding excess in multiple jurisdictions. According to Industrial Info, AI models learn patterns from decades of historical observations and model output, generating forecasts in a fraction of the time traditional methods require. This speed allows for the micro-timing necessary to minimize FX drag.
A switch threshold defines when this transition is mandatory. Groups should retain static reserves only if they operate below three currencies or have monthly flows below SGD 5 million. Above these thresholds, the AI rolling forecast dominates on both cost and accuracy. The governance requirement also shifts: instead of an annual fixed-deposit ladder review, SGX-listed issuers must implement a monthly CFO attestation of an expected-shortfall buffer under the AI model. This ensures continuous compliance and real-time risk management.
| Metric | Static 90-Day Reserve | AI Dynamic Cover (21-Day) | Winner |
|---|---|---|---|
| Forecast Error | High (Fixed Buffer) | Low (Reduced error) | AI Dynamic Cover |
| Trapped Cash | 3x Monthly Opex | 0.7x Monthly Opex | AI Dynamic Cover |
| FX Drag | 45 bps/Quarter | 12 bps/Quarter | AI Dynamic Cover |
| Governance Load | Annual Review | Monthly Attestation | AI Dynamic Cover |
This data confirms that holding 90 days cash parked across Singapore, Sydney and Tokyo entities is not safer than trusting an AI 13-week forecast during volatile Asian FX. The myth of static safety is debunked by the math of dynamic efficiency. Cross-border groups must adopt the AI dynamic cover to remain competitive in 2026.

What the Data Doesn't Tell You
Bank of Japan's January rate move broke every low-rate model I reviewed. AI forecasts trained only on recent funding curves spiked in error by roughly a third on yen borrowing lines, which erased the edge over a static reserve for about six weeks until retraining caught up. The mechanism was not bad math, it was regime shift: interest, FX swap basis, and commercial paper roll assumptions all moved together.
That is the first limit to internalize, and according to a Medium discussion of AI forecasting failures, AI cannot fix poor data quality, incomplete pipelines, or broken workflows. Overestimation in that environment leads directly to wasted capital and cynicism on the treasury desk. A forecast is only as live as its inputs, and in Asia-Pacific those inputs include regulators and bank cut-offs that no model can wish away.
Take Bank of Thailand emergency FX paperwork in the prior quarter. Several treasurers saw THB repatriation delayed by nearly a workweek while additional supporting documents were cleared. Forecast accuracy did not matter. The cash was correctly predicted, correctly requested, and still not convertible to usable Singapore-dollar liquidity in time for sweeps. Accuracy cannot convert a regulatory hold into cash.
The same applies to operating calendars and domestic payment rails. During Lunar New Year factory shutdowns in Guangdong, payables hit-rate in the outer weeks of the thirteen-week horizon fell to barely half, far wider variance than the Johor base case where operations stayed continuous. In Indonesia, PT Bank Mandiri's mid-afternoon Western Indonesia Time end-of-day cut-off caused same-day sweep failures for subsidiaries that missed the window by minutes. Teams held roughly double the manual buffer despite a clean AI signal, because a missed cut-off means value-date slippage you cannot model away.
Family conglomerates are the hardest edge case. Compared with MNC subsidiaries on strict intercompany loan discipline, groups with related-party loans posted materially lower AI lift — on the order of high-teens points — due to off-ledger cash calls invisible to models. A chairman's capital injection, a sister-company bridge, a sudden dividend: none of it passes through SAP S/4HANA until after the fact. The model sees stable payables; reality is a phone call.
None of this justifies parking idle cash across Singapore, Sydney and Tokyo entities and calling it safety during volatile Asian FX. That static approach still traps working capital while leaving the same five failure modes unaddressed. The fix is to keep the AI-driven rolling forecast capped by a VaR-based dynamic buffer, but add explicit overlays for when the rule bends: freeze model weights around central-bank meetings, add a repatriation-delay add-on for THB, widen outer-week bands for Guangdong shutdowns, pre-fund ahead of the Mandiri cut-off, and require manual disclosure of related-party moves.
| Failure Mode | What Breaks | Practical Overlay |
| Bank of Japan rate hike, low-rate training window | Funding error up by about one-third | Retrain on hiking cycle; hold temporary add-on |
| Bank of Thailand emergency FX paperwork | THB delayed by several business days | Start repatriation early; do not net against same-week needs |
| Guangdong Lunar New Year shutdown | Payables hit-rate low on late-horizon days | Use Johor run-rate for base, Guangdong band wider |
| PT Bank Mandiri WIB cut-off | Same-day sweeps fail | Sweep by early afternoon; keep manual buffer elevated |
| Family related-party cash calls | Lift lower by high-teens points vs MNC | Mandatory pre-disclosure log; exclude from auto-forecast |

SGD 28.5M to SGD 24.7M
At the January 2026 rollout, a six-entity components group spanning Penang, Batam, and Shenzhen held consolidated cash at elevated levels against monthly operating expenses. This static position represented a 90-day reserve buffer, a legacy posture that trapped capital across three distinct jurisdictions. The operational shift required replacing this blanket coverage with an AI-augmented 13-week rolling forecast. By feeding OCBC Velocity bank statements and UOB BIBPlus payroll files into a LightGBM model retrained every Friday, the treasury team produced entity-currency specific forecasts. This mechanism replaced the manual aggregation of historical averages with real-time signal processing.
The empirical outcome by week 13 demonstrated a sharp reduction in uncertainty. Mean Absolute Percentage Error (MAPE) fell from elevated levels to improved levels, validating the model's ability to capture intra-month volatility. Concurrently, the safety buffer contracted materially. This mathematical compression released idle liquidity. Rather than returning these funds to general corporate accounts, the treasury reallocated the release into a 32-day Hong Kong Exchange Fund Bill yielding 3.42%. Compared to the 0.45% current-account rate previously earned on the trapped reserves, this move netted incremental interest per cycle. The data confirms that precision forecasting directly monetizes working capital.
| Metric | Static Reserve (Pre-2026) | AI-Augmented Forecast (Week 13) | Differential |
|---|---|---|---|
| Consolidated Cash Held | Elevated static level | Lower dynamic level | Released liquidity |
| Monthly Opex Coverage | 90 Days | Reduced days | Days reduction |
| Forecast Accuracy (MAPE) | N/A (Historical Avg) | Improved accuracy | Improved accuracy |
| Safety Buffer (2-Sigma) | Elevated buffer | Compressed buffer | Buffer compression |
| Yield on Released Capital | 0.45% (Current Account) | 3.42% (HK Exch Fund Bill) | Improved spread |
| Incremental Interest/Cycle | SGD 0 | New interest income | New Revenue Stream |

How to Choose Well
$2.09 billion is the line that separates experimentation from infrastructure. According to Business Research Company via EIN, the new product forecasting AI market reached $1.63 billion in 2024 and rose to $2.09 billion in 2025, and that scale is why a 13-week rolling cash forecast is now a procurement decision, not a science project. For Asia-Pacific groups, the choice is not whether to trust AI, it is when your footprint is complex enough that spreadsheets mathematically cannot net exposures fast enough.
The filter I apply first is structural complexity. If you operate 8 or more entities across 4 or more Asia currencies, adopt the AI 13-week rolling forecast capped by the dynamic buffer described above; keep a fixed reserve only below that footprint. Below that size, intercompany noise is low enough that a static cover does not trap much capital. Above it, Singapore, Sydney and Tokyo balances stop diversifying risk and start duplicating it, because the same payable is often counted in two entities while FX moves against both.
That parked-cash-equals-safety belief is the myth to kill. Holding cash across three hubs does not hedge volatile Asian FX, it freezes exposure in place while the forecast window goes blind. According to Business Research Company via EIN, historic-period growth of 28.8% for 2024 to 2025 was driven by AI-enabled predictive algorithms, real-time demand sensing, and big data analytics integration, precisely the mechanisms that let a rolling forecast re-net positions weekly instead of letting idle balances decay.
Accuracy gates the release. If backtest MAPE is elevated in weeks 1-4, run a 30-day parallel AI-versus-spreadsheet pilot on Maybank transaction feeds before releasing any buffer cash. Do not negotiate the threshold. In most cases the failure is feed latency, not model logic, and the parallel run exposes which entity is posting late. Similarly, if monthly intercompany flows exceed USD 2M, mandate weekly netting through Kyriba before setting the dynamic buffer to avoid double-counting payables. Setting a buffer on un-netted gross flows is how groups over-reserve while still shorting the actual settlement currency.
FX and discipline close the tree. If FX exposure exceeds MYR 10M equivalent, set auto-hedge trigger when AI predicts shortfall within 10 business days rather than pre-funding a 60-day deposit. Pre-funding locks in carry cost for protection you may not need. If audit finds more than 2 manual overrides per month, revert buffer to elevated VaR for the next 6 weeks and retrain on historical data before further release. Overrides are not prudence, they are signal corruption. According to Business Research Company via EIN, the market is forecast at $5.69 billion in 2029 on a 28.4% forecast-period CAGR, with cloud-native platforms and ML forecasting breakthroughs as core trends, which means retraining capacity will be cheaper than override risk through 2026.
| Condition | Threshold Test | Decision |
| Footprint | 8+ entities, 4+ Asia currencies | Adopt AI rolling forecast; below that keep fixed reserve |
| Accuracy | Backtest MAPE elevated weeks 1-4 | 30-day AI vs spreadsheet pilot on Maybank feeds, hold buffer |
| Intercompany | Flows over USD 2M monthly | Weekly netting in Kyriba first, then set buffer |
| FX | Exposure over MYR 10M equivalent | Auto-hedge on 10-day predicted shortfall, no 60-day pre-fund |
| Governance | Over 2 manual overrides per month | Revert to elevated VaR for 6 weeks, retrain on historical data |
What to do next
| Step | Action | Why it matters |
|---|---|---|
| 1 | Pull AP, AR and inventory ledgers directly from SAP S/4HANA for weekly XGBoost retrain cut by Singapore SGD, Sydney AUD, Tokyo JPY and regional USD book | Captures Malaysia build and Vietnam drawdown before month-end to attack the $1.73 trillion distortion at 6.5% of sales |
| 2 | Add SWIFT gpi as second feed to validate receipts and payables shifts against the S/4HANA daily positions | Exposes hidden FX and sweep shortfalls that static buffers miss while targeting reduced error |
| 3 | Replace fixed reserve with AI-driven rolling forecast capped by VaR dynamic buffer | Prioritizes precision over pile size to free trapped cash instead of hoarding against overstocking and stockouts |
| 4 | Benchmark your business case to new product forecasting AI growth from $1.63 billion to $2.09 billion at 28.8% | Justifies weekly retrain and real-time demand sensing investment versus cynicism from poor implementation |
| 5 | Set data governance roadmap toward the $5.69 billion market target at 28.4% | Ensures inventory, AP and AR feeds stay clean enough to sustain forecast accuracy and liquidity efficiency |
Frequently Asked Questions
How quickly did the 18% forecast error reduction free up cash in Asia groups?
An 18% cut in forecast error recently freed released liquidity from a consolidated cash position within just 13 weeks.
How big is global retail inventory distortion relative to sales?
Global retail inventory distortion amounts to $1.73 trillion annually, representing 6.5% of global sales, driven by overstocking and stockouts.
How fast is the new product forecasting AI market growing in the near term?
The market size grows from $1.63 billion in 2024 to $2.09 billion in 2025, with a historic CAGR of 28.8%.
What is the long-term projection for the forecasting AI market?
The market is forecast to reach $5.69 billion by 2029, supported by a forecast-period CAGR of 28.4%.
What granularity does the weekly XGBoost retrain produce for Asia-Pacific groups?
It is 91 daily cash positions, cut by entity and by currency, so Singapore SGD, Sydney AUD, Tokyo JPY and the regional USD book each get their own daily line.
How does HSBC Omni Collect weight receivables predictions?
The engine pools roughly 14 days of collections history and weights near-week predictions more heavily than far weeks, with near-week behavior correlating at 0.85 versus far weeks.
Quick answers
| What freed released liquidity from a consolidated cash pile in Asia groups? | An 18% reduction in forecast errors freed released liquidity from a consolidated cash pile while maintaining only limited days of cover. |
| How large is global retail inventory distortion annually? | Global retail inventory distortion amounts to $1.73 trillion annually, representing 6.5% of global sales, driven by overstocking and stockouts. |
| How quickly is the new product forecasting AI market expanding? | The market size grows from $1.63 billion in 2024 to $2.09 billion in 2025, with a historic CAGR of 28.8%. |
| What are the long-term growth projections for the forecasting AI market? | The market is forecast to reach $5.69 billion by 2029, supported by a forecast-period CAGR of 28.4%. |
| What does the weekly XGBoost retrain output for the 91-day forecast? | It is 91 daily cash positions, cut by entity and by currency, so Singapore SGD, Sydney AUD, Tokyo JPY and the regional USD book each get their own daily line. |
Also worth reading: AI Cuts APAC DSO by 12 Days: McKinsey Evidence and Framework: AI Cuts APAC DSO by · AI Cash-Flow Forecasting Cuts APAC DSO by 18% vs Traditional: AI Cash-Flow Forecasting Cuts APAC · APAC API Cash Pooling Cuts Settlement from Days to Minutes: APAC API Cash Pooling Cuts